14 July 2020
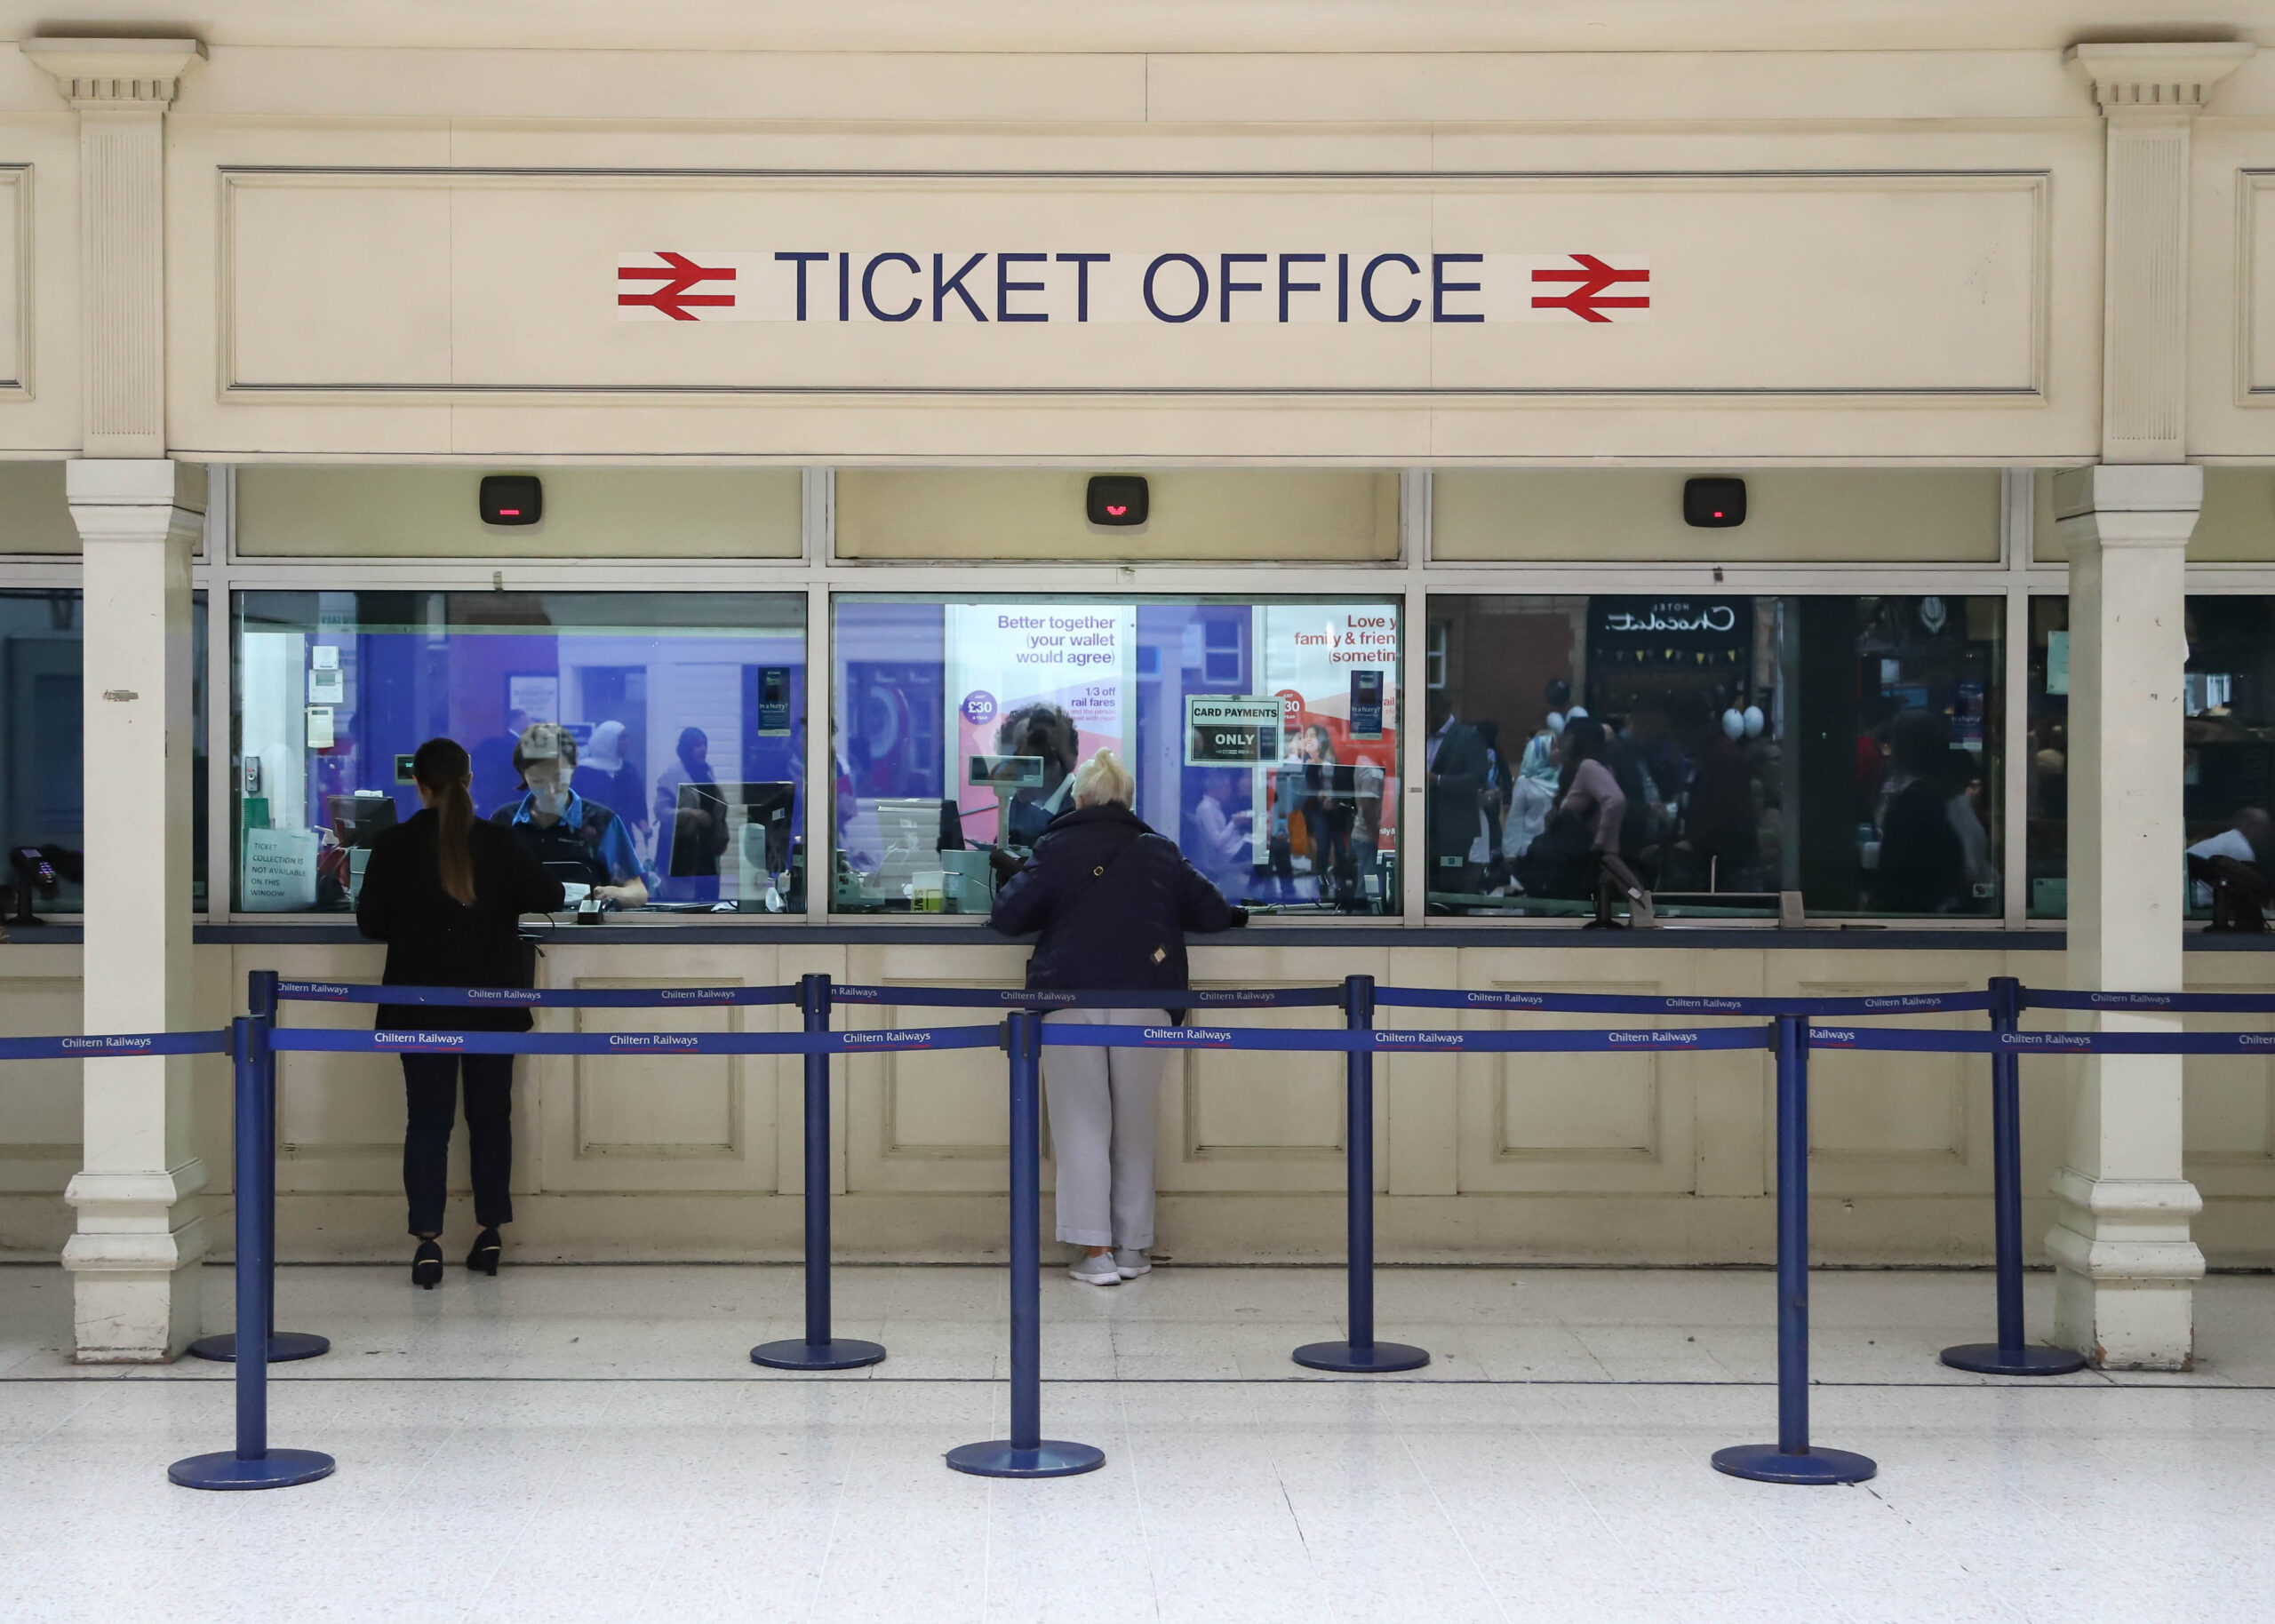
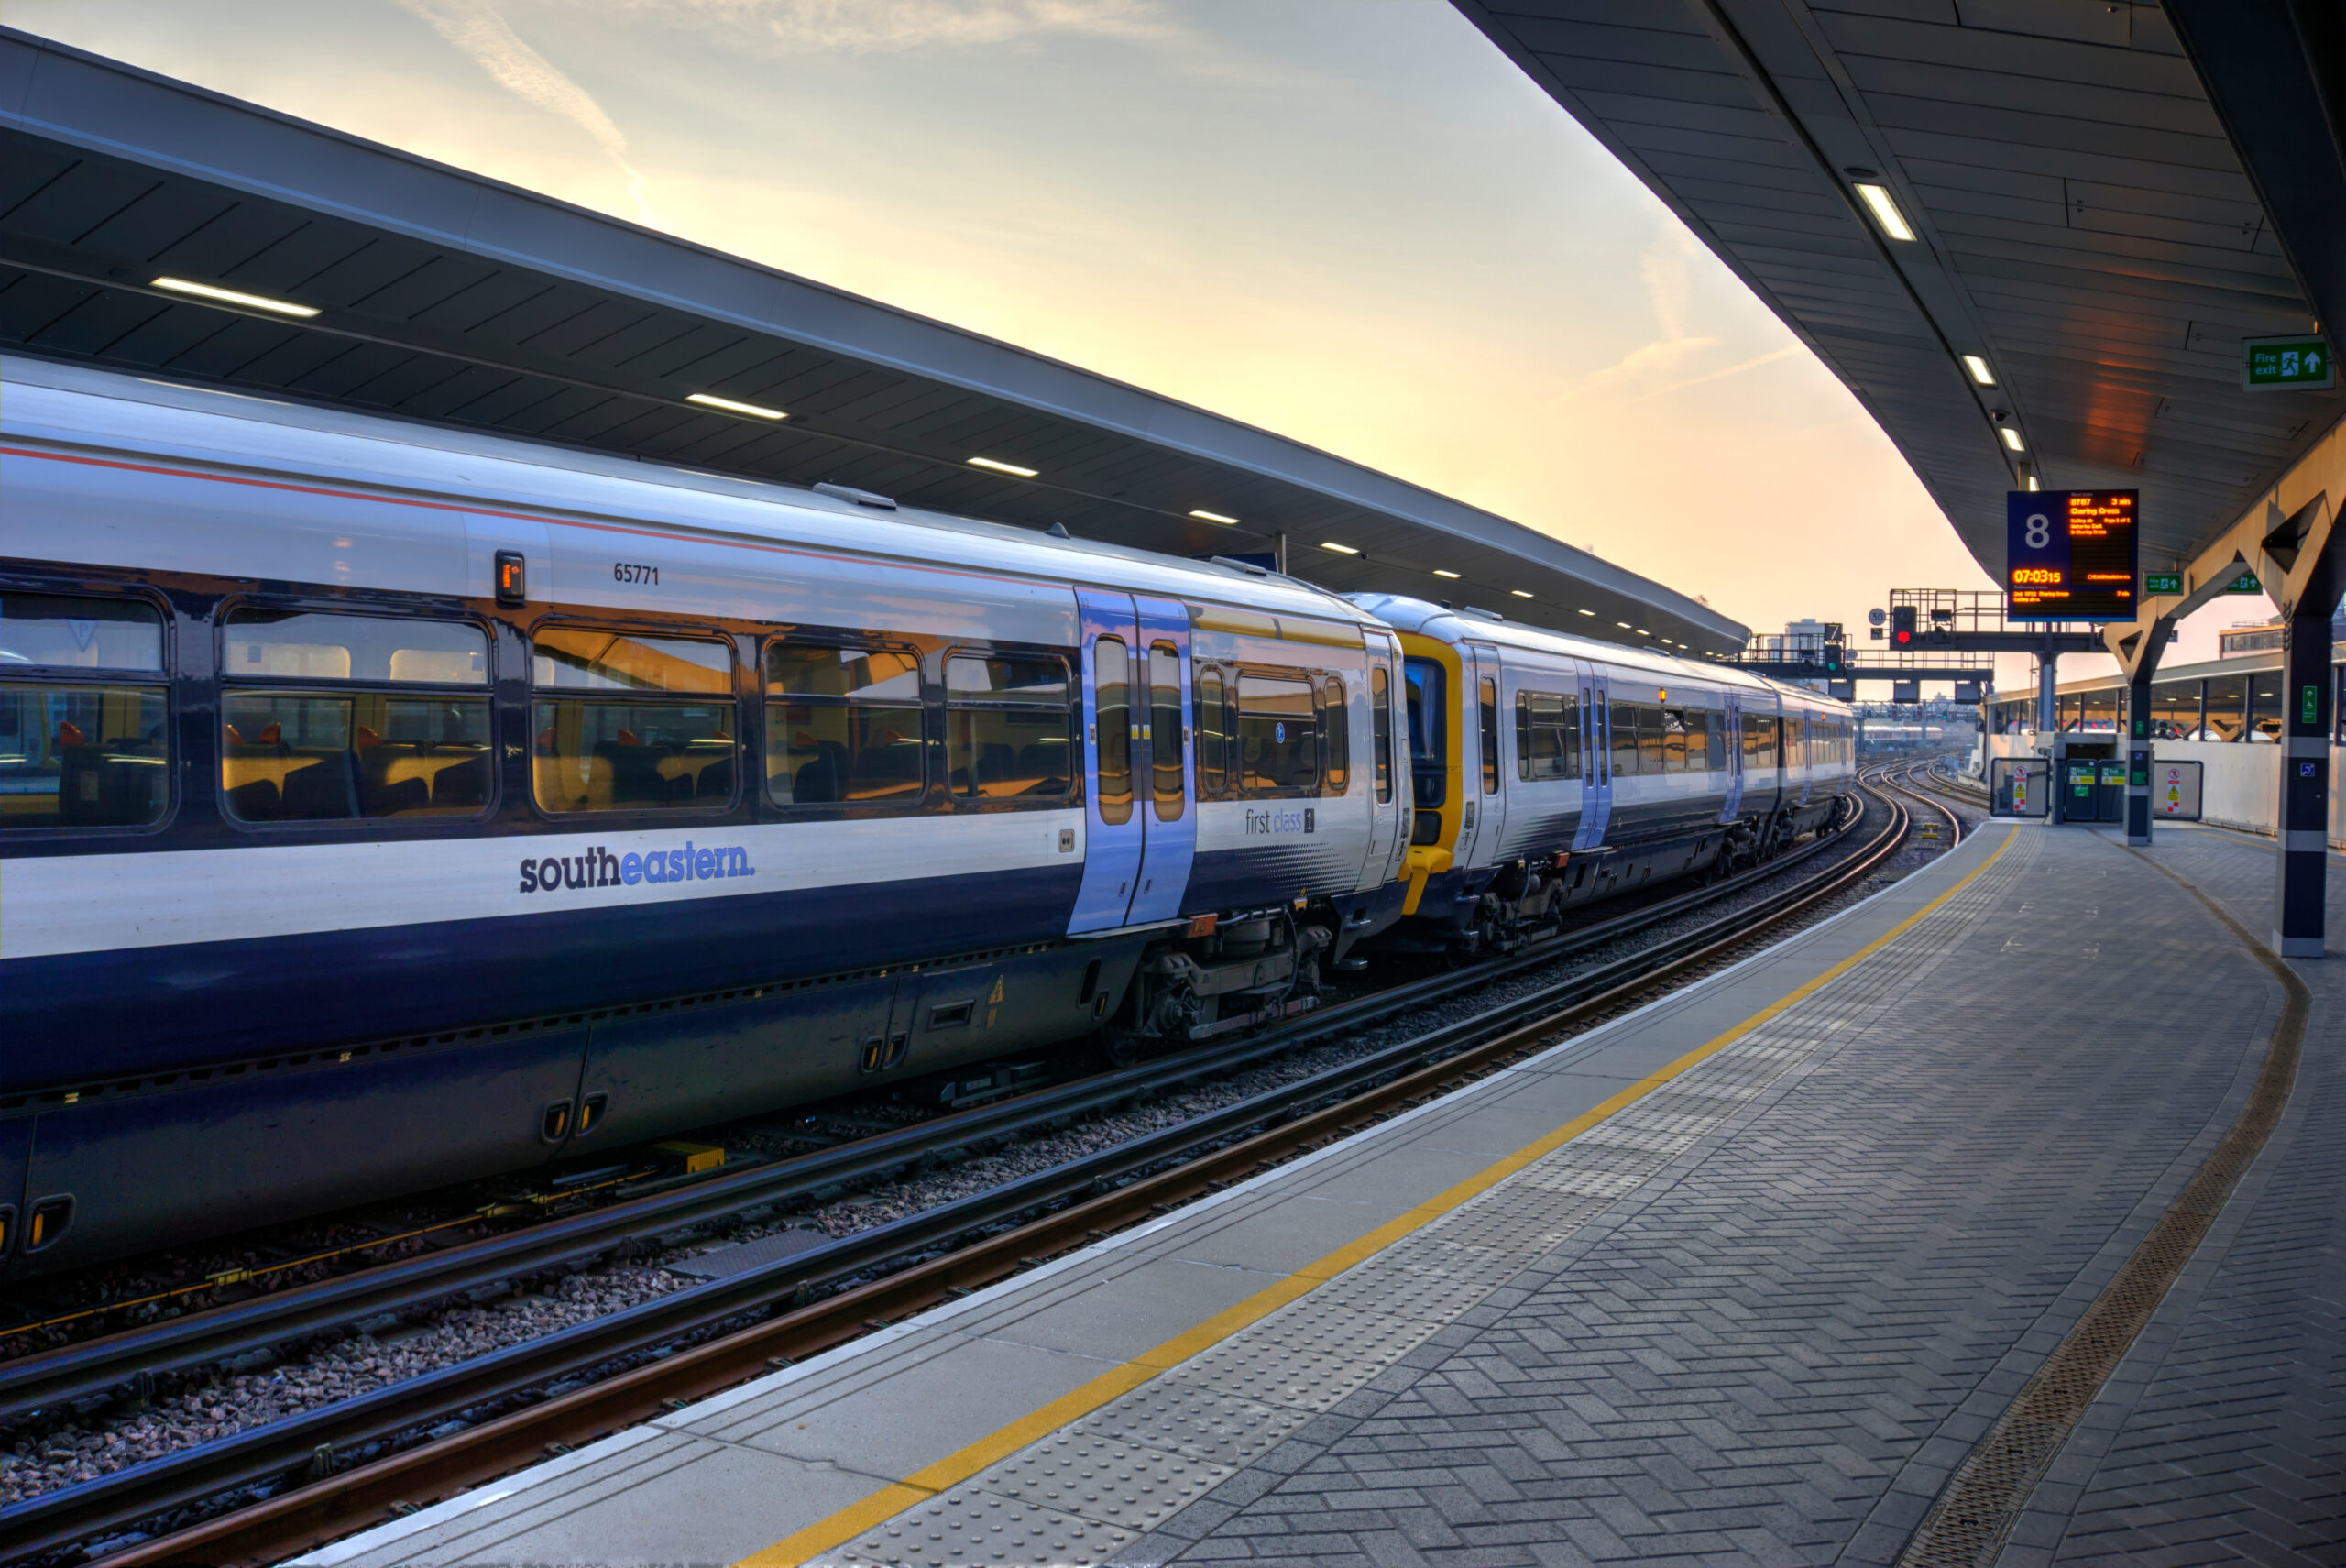
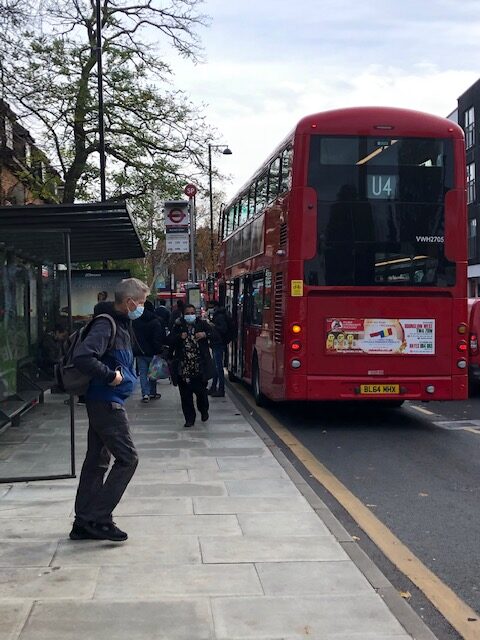
London’s extensive public transport system stretches out to all parts of the capital. Even during the Covid-19 lockdown, most of it has remained operational although often running at reduced frequencies. Both during lockdown and now, as restrictions have started to ease, it has been particularly vital for those who have needed to make essential journeys because they have no alternate means of transport.
This importance has been highlighted in a recent national survey undertaken by our sister organisation, Transport Focus*. It revealed that Londoners rely on public transport more than anyone else in the country and that they have been using it more often than those outside the capital.
The findings show that, when asked if they expected to make a journey using public transport at some time in the future, just 16% of all passengers nationwide said that they would do so in the next week. However, this rose to 25% of those who were expecting to use London’s public transport in the future and 51% for those who had already used London’s public transport since lockdown started.
This discrepancy is reflected in the frequency of public transport use, with Londoners using public transport more frequently than those outside of the capital. 70% of London passengers who had already used public transport since lockdown started to use it at least around once a week, compared to just 53% of all passengers.
The survey results also highlight that Londoners have fewer options making journeys. 65% of Londoners who had already been travelling since lockdown started said that public transport was their only option to make the journeys they needed to in the future. This compares to only 42% of all passengers. In terms of having an alternative, only 15% of Londoners say they can make these journeys without using public transport compared to 24% of all passengers.
Such differences are reflected in the different levels of car ownership across the UK. TfL’s latest publication of travel and transport trends in the capital reported that in 2017 there were nearly 2.7 million cars licensed in London** but Londoners have fewer cars per thousand of population than any other region of the UK, with its number 40% lower than the UK average***. Car ownership also varies considerably within the capital, with only 40% of inner London households having a car, compared to 68% of outer London households****.
Levels of car ownership in London are of course a reflection of many social and economic factors although the provision (or absence) of the alternative of public transport is a significant factor amongst them.
Yet Londoner’s overall reliance on public transport can also be seen as evidence of how comprehensive and convenient it is, with most parts of the capital having a bus route or tube or train station nearby running services every day, often from early morning until late at night. It can also be a relatively inexpensive option, particularly on buses since the introduction of the Hopper fare and daily cap.
By contrast, in more rural parts of the UK and even in some other towns and cities, the public transport network can be less comprehensive, operates to shorter hours and may be more expensive (especially when traveling by bus). Here, owning a car is not just more convenient but may also be more affordable than using public transport.
In a social and economic context, London has become more dependent on public transport in the past 20+ years as development has been more intense here, with clusters of homes and jobs around public transport hubs.
Economic recovery for London means that public transport has to play a significant role alongside the growing idea of 20 minute neighbourhoods (the concept of ‘living locally’, where people can meet most of their everyday needs within a 20-minute walk or cycle trip of their home). The alternative is a reliance on the car, which will simply result in more congestion, more pollution and more health risks – and which will ultimately stifle economic growth.
* Social distancing and public transport: Transport User Panel survey, June 2020
** Travel in London Report 12, 2019, p70
*** Department for Transport vehicle licensing statistics – Licensed vehicles at the end of the quarter by body type and region, including per head of population, United Kingdom, 2020 Q1
**** Travel in London Report 12, 2019, p70